coming into play – HK Land

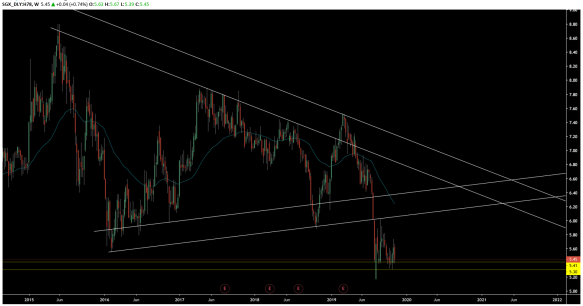
HK Land has recently come into the spotlight due to it’s current trading price (2010 price) and its domestic political issues. It seems like there’s a high correlation between its bearish short-term trend and it’s current civil unrest.

chart-1575439602812.png

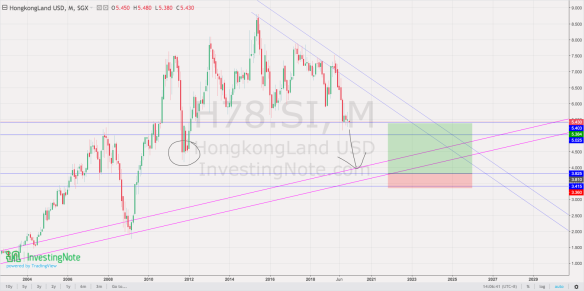
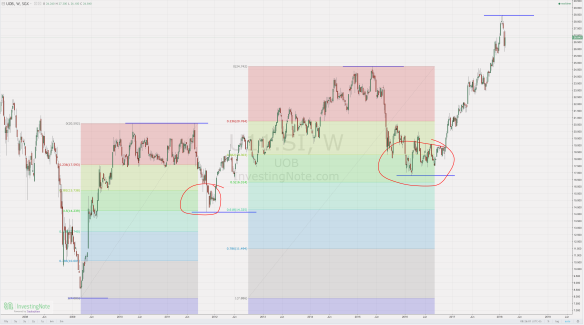
Would love to see price action trading at 3.825 level before executing a buy order instead of current price point. This come with the knowledge that many fund houses are pulling money out from equities in eagerness for a crash.

Doesn’t seem like a long wait, patience is what gives the greater value.

Remember we are betting on probabilities and not certainties.

Please do your own due diligence, i’m just alittle noobie

HongKong Land – 14/10

WWeekly timeframe shows a clean breakout of structure as it clears through channel support with a bearish crossover on the 50EMA. Tentatively, price at the level of 5.30 becomes highly sensitive prior to ’08 crash as it was the ’07 highs.

Market momentum seems to be building up through a ranging motion of price action (5.90~5.40).

d.png

As observed, market is showing similar price action on the Daily, with the crossover of the 50EMA while lower highs are formed. My bet would be one that HKLand holds a high bearish probability. – at least for now.


I’ve recently just gotten on Patreon, you can support more of my work while at the same time reaping some benefits.


Please note that this article should not be construed as formal investment or financial advice. Pretty please, conduct your own due diligence.

Singtel – Up up?

Are we on a setup for a new bullish trend as market retraces back towards its prior breakout?

Singtel seems to have found new strength as it retest May support levels. A higher winning probability seems to be leaning on a bullish side. As market still have a good 30cents more before testing a key region, are you long or short?

chart-1571989999498.png

Soilbuild

its interesting to take on the perspective of who owns this company. It even more intriguing to see the general public owning 58% and institution owning 11%.

Is Mr Chap sweeping this REIT at discounted price?

chart-1570089558847

source; investingnote

Since i started on correlation the last post, it is only fair for me to continue the idea of correlation on this. Can you spot it? the one in purple is Soilbuild.

Note; don’t expect a 1:1 correlative behaviour but take the basic principle of movements.

a pipe dream is better than no dream


another way to see First Reit?

Singapore first Healthcare Reit, managed by Bowspirit Capital owned by OUE (60% to limited and 40% to Lippo healthcare limited), it is Indonesia broad based listed company.

Something i thought would be interesting for you all to look at, would be the country’s “health” position before hedging your bet on this REIT.


Source : http://www.depkes.go.id/resources/download/pusdatin/profil-kesehatan-indonesia/indonesia-health-profile-2017.pdf [for you to read more]


Everyone has their own narrative for why their analysis is right, but remember, its your own money, and only you are accountable for what is yours.

Soilbuild – no correlations?

Just numbers and chart – Do your own due diligence pls

Gross revenue(M) Net Income (M) Occupancy Weighted average lease Leverage Distribution per unit NAV/unit Total debt
2018 83.8 69.9 89.5 3.9 39.1 5.284 0.63 515719
2017 84.8 73.5 92.7 3 40.6 5.712 0.64 512965
2016 81.1 70.7 89.6 3.4 37.6 6.091 0.72 523788
2015 79.3 67.8 96.8 4.8 36 6.487 0.8 468557
2014 68.1 57.4 100 3.9 35.4 6.193 0.8 403192
Average 79.42 67.86 93.72 3.8 37.74 5.9534 0.718 484844.2
Average Over 5 Years 4.61% 4.36% -2.10% 0.00% 2.09% -2.94% -4.25% 5.58%

chart-1569051156992.png

My personal take is that financial number doesn’t reflect much correlation towards price action. I do think the shorting of this REIT comes mainly from the words and management direction from the annual report.

Generally, we all have seen companies with “worse-r” financial numbers and unexplainable price spikes.

I’m overall bullish on this still – loser loser armpit sellers


14/2/18 – UOB

Screen Shot 2018-02-14 at 8.25.56 AM.png

Weekly Chart Analysis – Price action on the stock indicates that it is in an overall bull trend ( started in 2009 ), making higher highs and higher lows. Something I spotted was that market tends (high probability) to retrace to the 0.5 area before moving higher.

Current price action indicates a probable retracement more than a continuation of the trend.


Screen Shot 2018-02-14 at 8.36.46 AM.png

Daily Chart Analysis – Differs a lot from the weekly chart, where it shows that price action has recently respected previous structure low (maintaining the trend characteristic). The market still has a leg room to prove the retest, hence an entry now wouldn’t be a wise one.

The ideal entry would be an exhaustion in retracement like the current one, It will provide a better Risk to Reward Ratio.

2/2/18 – Singtel

Screen Shot 2018-02-02 at 1.50.02 PM.png

Weekly Chart: Price action on the stock seems to be trading in a consolidation range with an up build of a bearish character. If the market breaks 2016’s structure low, it would have completed a bearish trend requirement. Thus, increasing the probability of Singtel’s share price to drop even lower. What the possibility of that??

Screen Shot 2018-02-02 at 1.51.06 PM

Daily Chart – It seems that there’s a great probability of such happening, as price action has recently just broken previous structure low ~ forming a bearish trend. If you’re planning to long this stock, It would only be wise to be in when a retracement happens. I’d think Singtel has a high probability to be trading around 2013 price level.


26/01/18 AEM

Screen Shot 2018-01-26 at 4.06.22 PM.png

Daily Chart – Market has broken 2004 Highs with a strong bullish momentum that doesn’t seem to end? It holds an erratic bullish trend characteristic, as you can see sometimes market consolidates with a considerable amount of time and sometimes it doesn’t.

What do I mean? as you can see after the break of $1, makes tends to have a spurge growth in buyers (probably price followers) entering the stock this led to an immediate “unhealthy” growth in price which led to the drop of 80% (in the range of $2-1).

So what does current price tells me? The market tends to retrace sharply after a new “fast dollar break”. Thus, entries would be highly possible near the whole number.


19/01/18 – DBS Analysis

Screen Shot 2018-01-19 at 5.18.59 PM

Daily Chart – DBS has an overall bullish trend that is either losing some of its steam (short-term) or is trying to build traction. I would think the latter, as seen from previous price actions, market would have a high tendency to consolidate before making a new high.

So why did I say it might be losing some of its steam on the short-term? Pre-consolidation and post since the first circle shows that market has been growing 10% or greater, but on recent consolidation, market is growing at 8% or lower.

Then why do I think the latter is more true than the first? I believe market is ready to break into new highs and before doing so, it requires a chunky consolidated price actions (building traction/demand) before proving overall trend characteristic. In summary : this is a higher PROBABLE bet then the other.

I’d think market has a high chance to test previous structure low or form its new structure low. Thus giving traders a good entry opportunity so do watch out!