
Just numbers and chart – Do your own due diligence pls
| Gross revenue(M) | Net Income (M) | Occupancy | Weighted average lease | Leverage | Distribution per unit | NAV/unit | Total debt | |
| 2018 | 83.8 | 69.9 | 89.5 | 3.9 | 39.1 | 5.284 | 0.63 | 515719 |
| 2017 | 84.8 | 73.5 | 92.7 | 3 | 40.6 | 5.712 | 0.64 | 512965 |
| 2016 | 81.1 | 70.7 | 89.6 | 3.4 | 37.6 | 6.091 | 0.72 | 523788 |
| 2015 | 79.3 | 67.8 | 96.8 | 4.8 | 36 | 6.487 | 0.8 | 468557 |
| 2014 | 68.1 | 57.4 | 100 | 3.9 | 35.4 | 6.193 | 0.8 | 403192 |
| Average | 79.42 | 67.86 | 93.72 | 3.8 | 37.74 | 5.9534 | 0.718 | 484844.2 |
| Average Over 5 Years | 4.61% | 4.36% | -2.10% | 0.00% | 2.09% | -2.94% | -4.25% | 5.58% |
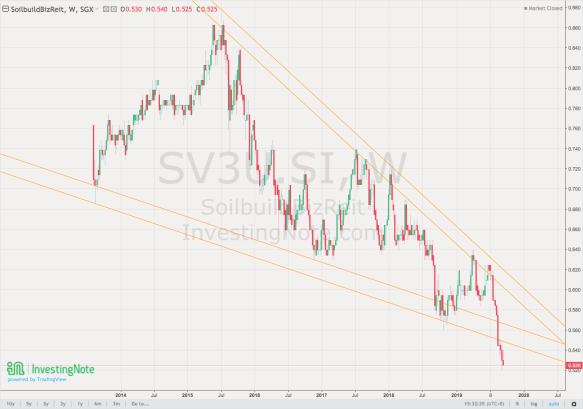
My personal take is that financial number doesn’t reflect much correlation towards price action. I do think the shorting of this REIT comes mainly from the words and management direction from the annual report.
Generally, we all have seen companies with “worse-r” financial numbers and unexplainable price spikes.
I’m overall bullish on this still – loser loser armpit sellers
